
- Utilise standard Templates
- Use The Project Filter To Analyse One Project, A Group of Projects or Your Whole Portfolio
- Use Report Elements To Create Custom User Templates
- Master The Advanced Pivot Table and the Custom Table
- Team Collaboration
Introduction
Good data allows your organisation to be on the same page. In development sales and marketing it’s going to allow you to understand your marketing spend and allocate resources accordingly, give you insights into your sales, trends such as which property type is most popular and your buyer profile, as well as internal insights into your sales team’s performance.
Agents and developers are often swamped with data but without the right tools to interpret it.
Property Shell centralises reporting from development, finance, sales, marketing, settlement, and customer teams turning raw data into actionable insights.
The importance of data in the property industry
Every deal, client interaction, and project milestone generates valuable data, having a system that analyses the data is key to informed decision making.
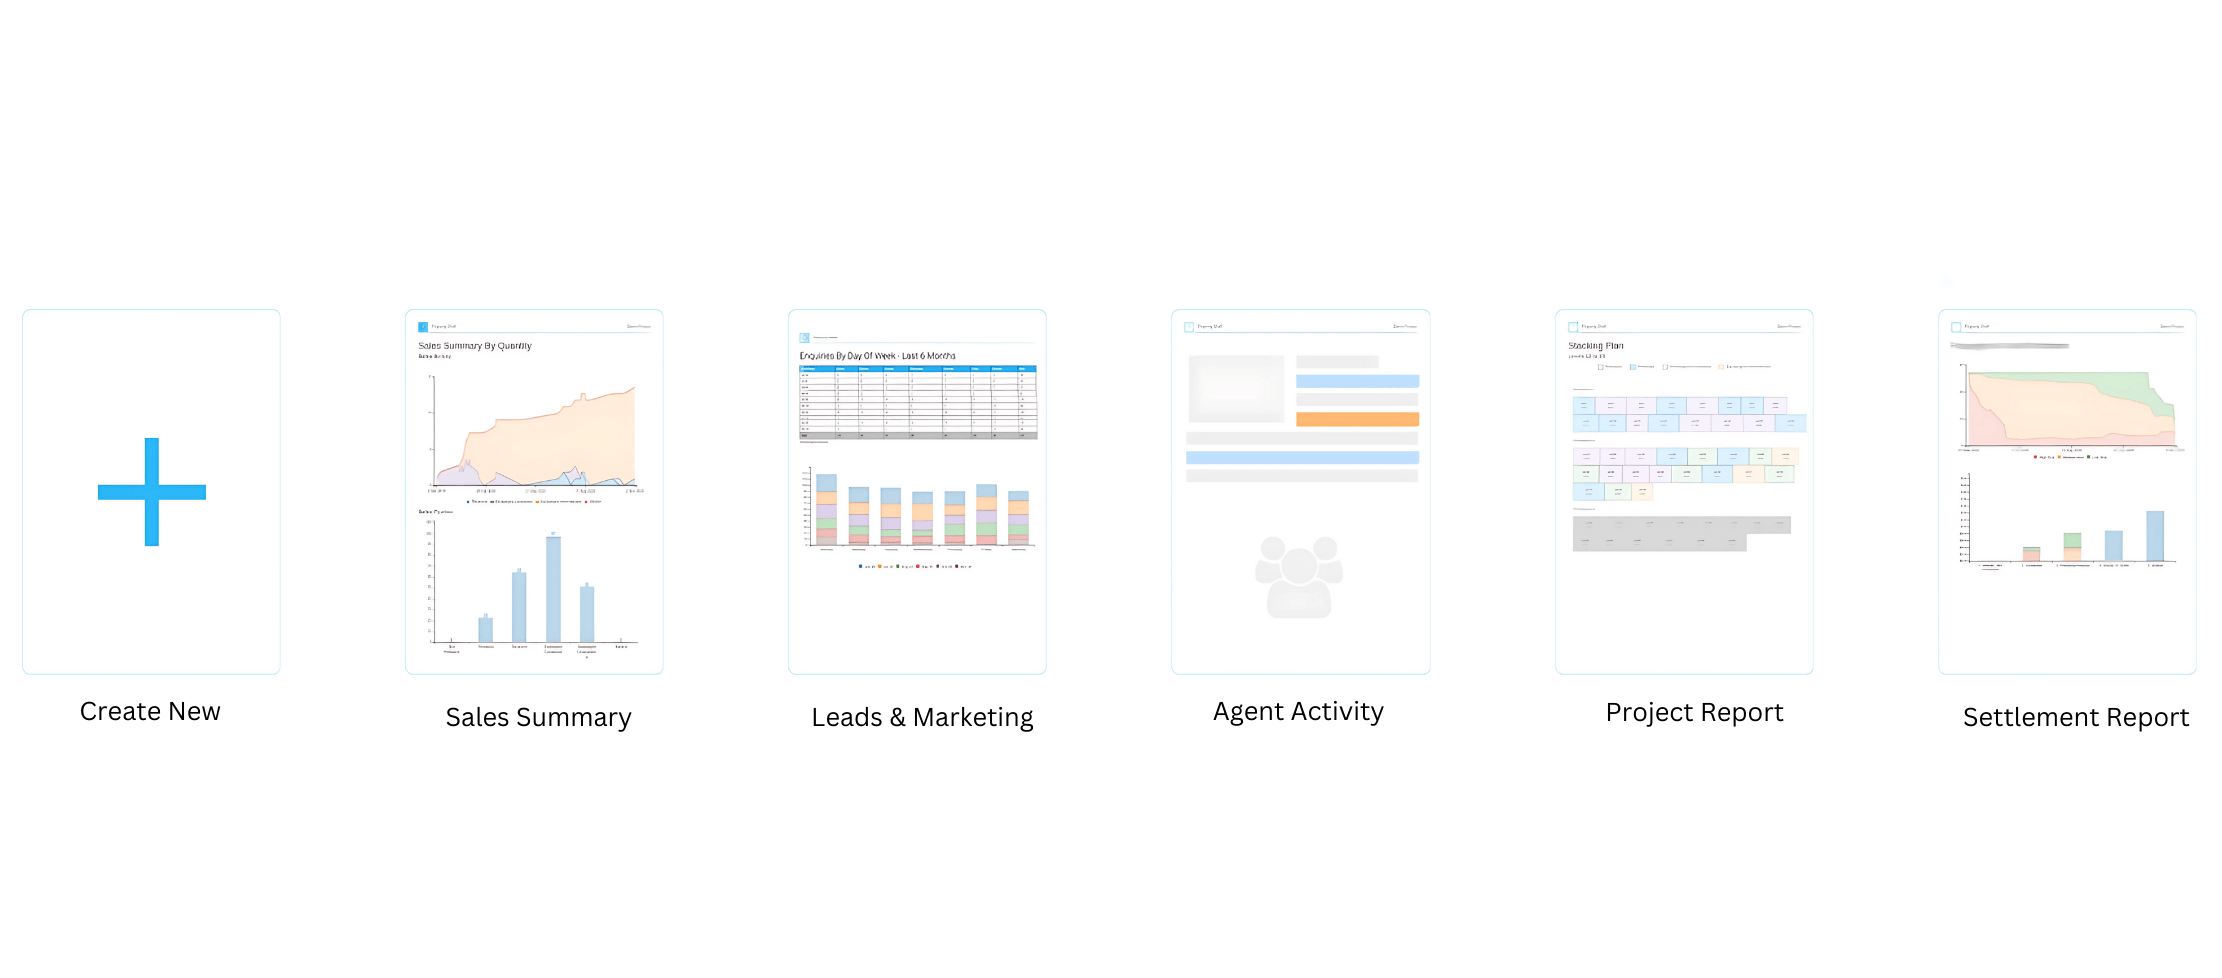
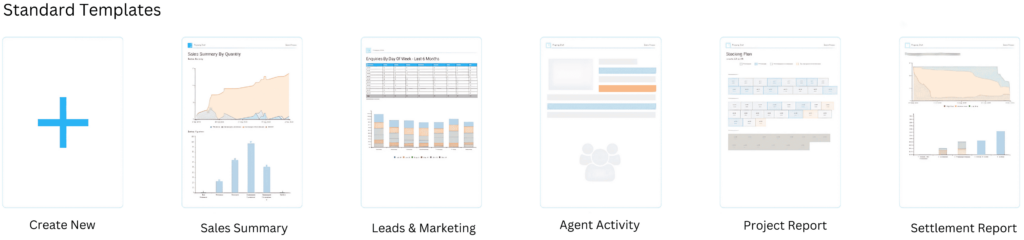
Utilise Standard Templates
Standard templates are your starting point for quickly looking up and finding data living in Property Shell. The data contained within these templates is designed to cover 95% of all your reporting needs.
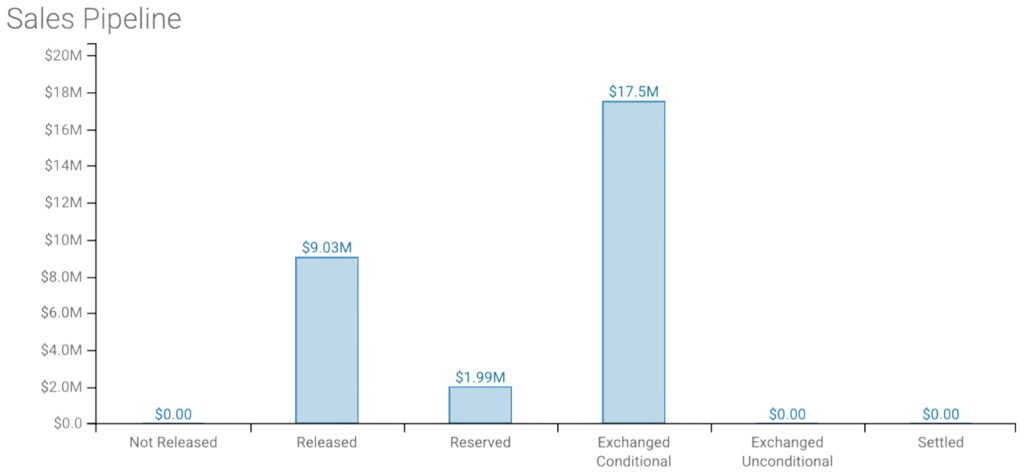
Sales Summary Need to check sales data? Open the Sales Summary to get a quick overview.
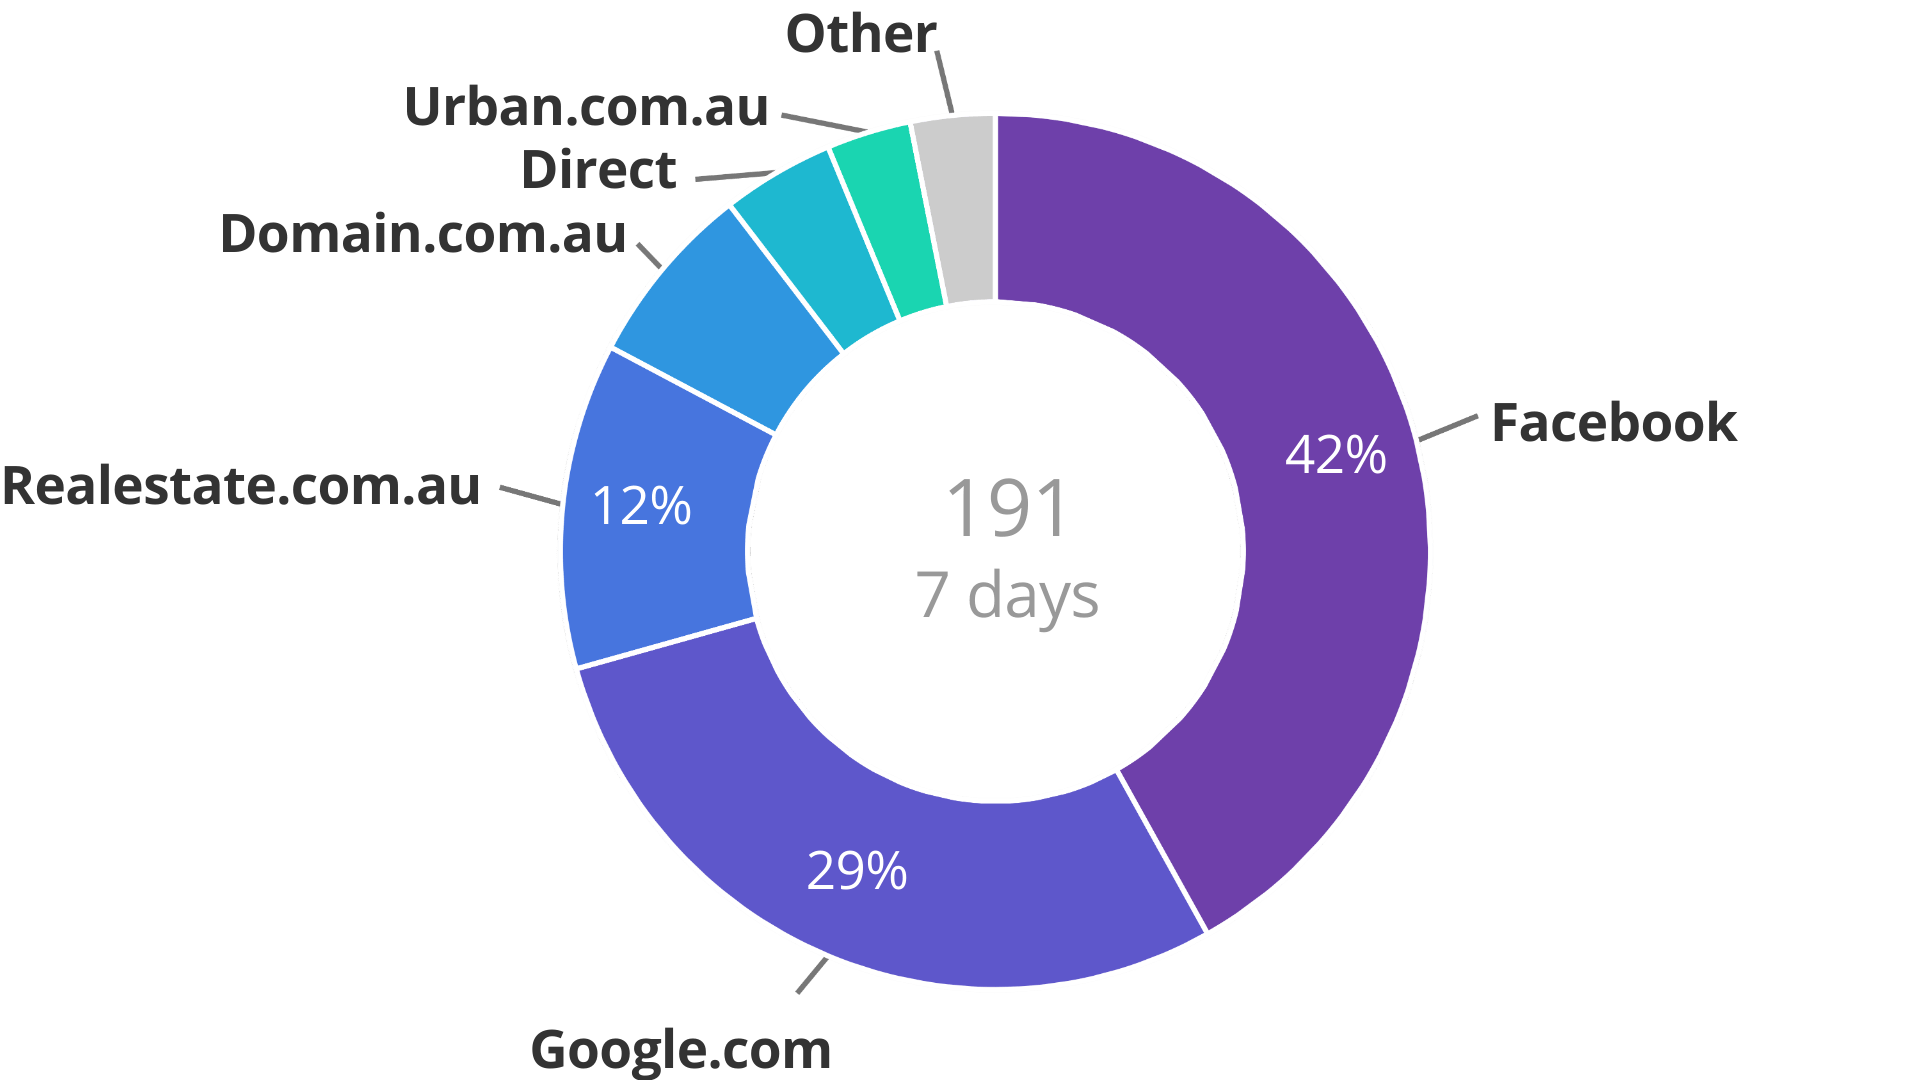
The leads and Marketing Report This gives you a snapshot of marketing performance, including enquiries, UTM tracking, lead locations, and referrers.
Agent Activity Want to know how many calls your sales team made last week? How about how many property inspections your team conducted last year? The Agent Activity Report gives you all this and more, even tracking the conversion rates of leads to inspections, reservations, and contracts. The agent activity report will also give critical data about rates of leads that book inspections, convert to reservations and finally sign contracts.
Use The Project Filter to Analyse One Project, A Group of Projects or Your Whole Portfolio
Property Shell gives you the flexibility to see data from one project, a grouping of projects, or from across your entire portfolio using the project filter.
Use Report Elements to Create Custom User Templates
Use Report Elements to Create Custom User Templates Report elements are premade graphs and tables that allow you to create your own reports from scratch. Think of the report elements as the building blocks for custom reports. It’s as easy as searching the list of available elements and adding them to your report template. There are Report Elements covering the entire sales lifecycle. from enquiry, lead management, to inspection bookings, marketing campaign activity, lead profiles, reservations, sales activity, cancellations, deposits, through to settlements.
Master The Advanced Pivot Table and the Custom Table
The Advanced Pivot Table and the Custom Table allow you to do anything and everything in reporting and analytics in Property Shell.
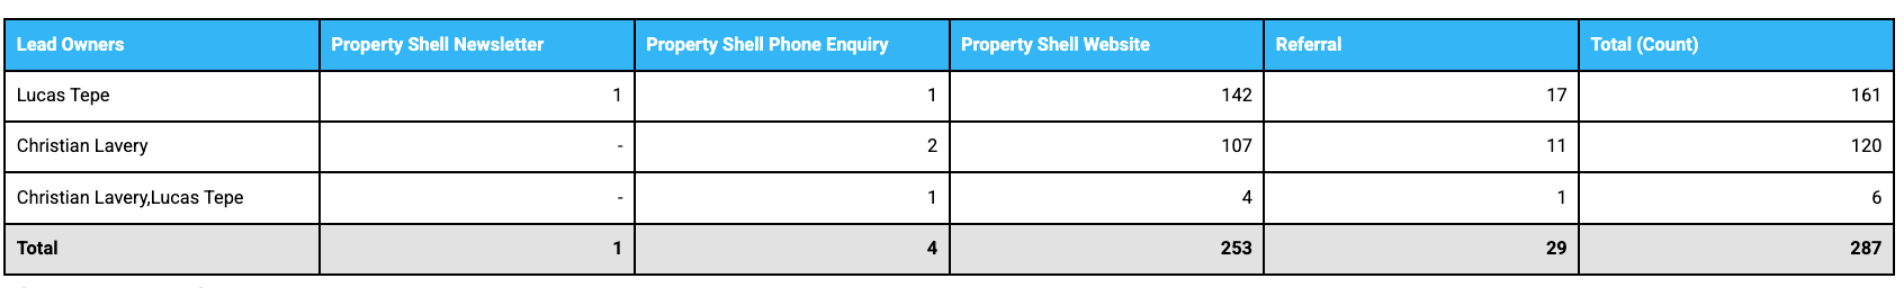
The Advanced Pivot Table allows you to analyse large amount of data in relation to each other. For example Enquiries by Week, Enquiries by Campaign, or Enquiries by Lead Owner. The easiest way to think about the advanced pivot table is that it has two axis’ in which you can pivot data on. You can use the advanced pivot table to summarize, analyse, explore, and present summary data.
The advanced pivot table also gives you the option to use bar graphs, line graphs, and pie charts.
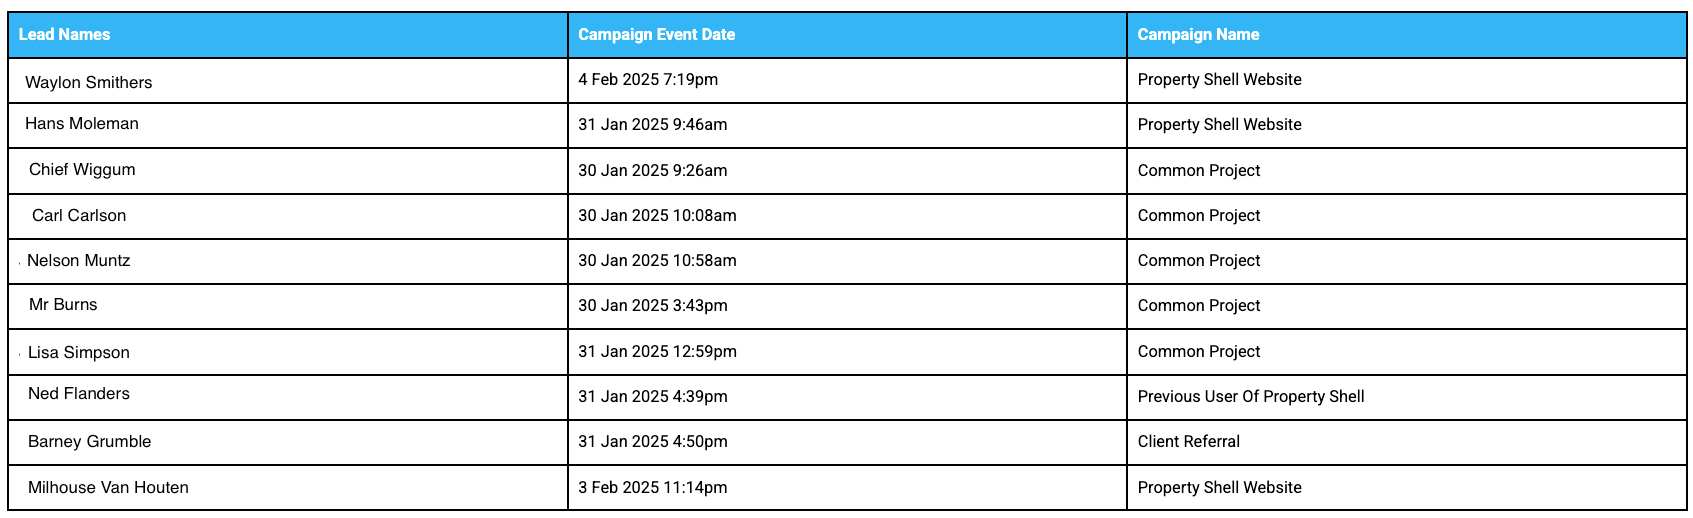
The custom table is just that, a table, so it doesn’t give you the option to display data in graphs or charts.
Instead of summarising data, The Custom Table displays the granular data itself. For example if you want a list of all the enquiries within a certain timeframe, the custom table will provide a list of each enquiry during this time frame.
This is the difference between the custom table and the advanced pivot table is that one if for analysing and summarising data, whereas the other gives the granular detail.
Team Collaboration
Effective collaboration is key in a data-driven organisation. With Property Shell, you can automate the sending of reports, ensuring that your team stays on the same page, from sales and marketing to development and finance. Once you’re satisfied with a reporting template, set up automatic sharing to send it to relevant stakeholders at regular intervals. This keeps everyone aligned and focused on the same objectives. This is achieved through Automations.
Turning Insights into Action
Property Shell’s Base Tables draw data from every aspect of the system, empowering users with super flexibility when it comes to analytics. Using the Advanced Pivot Table competently, gives us endless possibilities to turn raw data into easy-to-visualise insights. For example, after analysing the lead conversion report, you might decide to invest more in paid advertising for certain property types or send an EDM to leads that have been sitting in your CRM for longer periods.
With client interaction data, users can personalise their communication and follow-up strategies. This can lead to improved satisfaction and better long-term relationships. Reports can tell you which clients need regular updates and which have gone quiet, allowing you to adjust your communication approach accordingly.
The Future is Data Driven
Every deal, client interaction, and project milestone generates valuable data. Having a system that organises and analyses that data is key to making informed decisions.
- Summarise
- Detail
- Forecast
Property Shell’s reporting tools offer a powerful way to transform how you analyse your business. By using these tools, you can improve decision-making, boost team performance, and streamline collaboration across departments. Uniting disparate and often siloed data sources from across all aspects of the business from marketing, sales, finance, development, and settlement. Use reporting to quickly render summaries, or comb through granular data.
Ready to take control of your data? Reach out to schedule a training session with a technical account manager and start maximising the potential of Property Shell’s reporting tools today.